Cirrus v1.5 brings model guidance, observations and ensemble power forecasts into one workflow for assessing weather uncertainty.
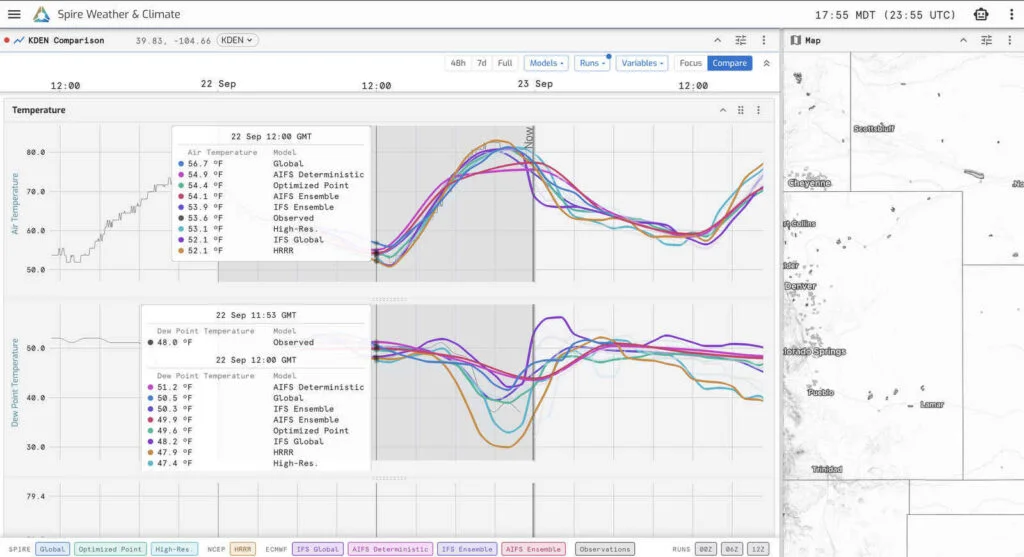
Weather uncertainty becomes more useful when forecasters can inspect its sources. Spire’s Cirrus v1.5 brings model comparisons, observations and ensemble power forecasts into a shared workspace, giving meteorologists and energy professionals a clearer view of where guidance converges and where outcomes remain open.
Released in September, the update adds model guidance from European forecasting centers, an ensemble-based power forecast, Madden-Julian Oscillation (MJO) visualization and new export options. The shift is practical: instead of treating one forecast as the answer, users can compare systems, check forecasts against observed conditions and examine ranges of potential generation.
Compare guidance at the point that matters
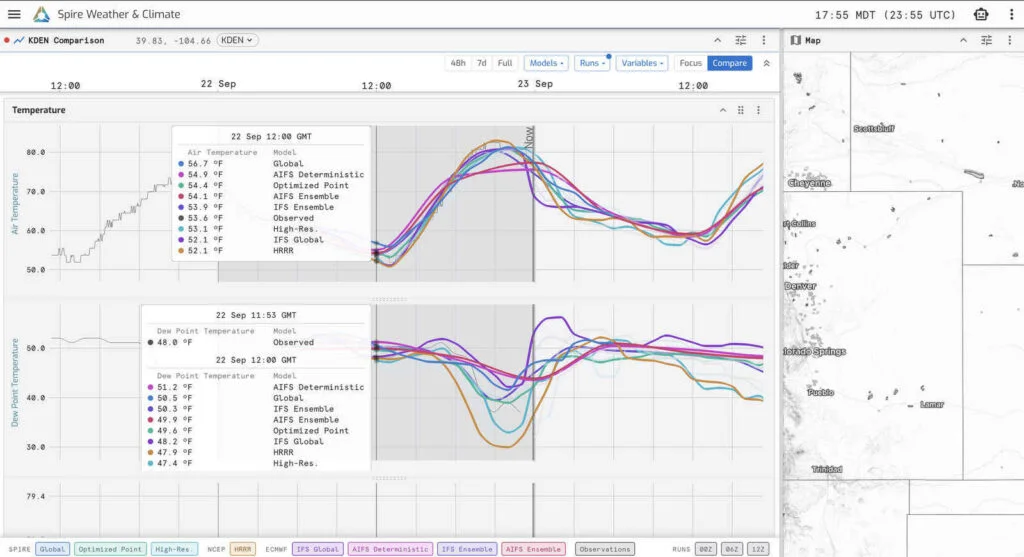
Compare multiple forecast models and observations at a single location to quickly identify where guidance agrees and diverges.
Model Comparison lets users choose a map location or an existing forecast site and inspect several sources of guidance together. Those include Spire High-Resolution Forecast, Spire’s global AI weather model, and products from the European Centre for Medium-Range Weather Forecasts (ECMWF) and the German Weather Service (DWD). Available products include ECMWF IFS Ensemble, ECMWF AIFS Ensemble and DWD ICON-EU.
The products cover different forecast needs. ECMWF ensemble mean and spread are available out to 15 days, while ICON-EU supplies hourly regional guidance for Europe. Bringing these views together gives forecasters a more direct way to examine how model architecture, initial conditions and data assimilation contribute to different forecast outcomes.
Cirrus offers two ways to view the selected guidance. Compare overlays models for a chosen variable, making differences easy to spot. Focus emphasizes one model while keeping the others visible as reference. Users can select combinations of models and runs, then move among synchronized 48-hour, seven-day and full forecast windows.
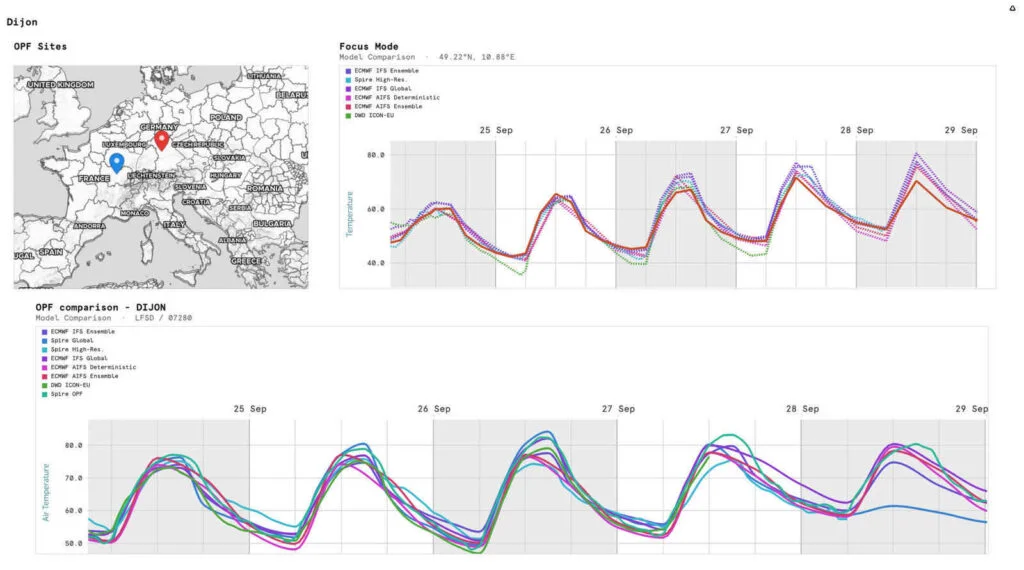
Compare mode reveals differences across models, while Focus mode highlights one forecast with other guidance retained for context.
That structure helps turn comparison into a targeted investigation. A meteorologist tracking a North Atlantic storm, for instance, can review its progress across model guidance on the map, then inspect a specific site to see whether models agree on timing but diverge on wind speed. Observations at that location add a further check: how does recent guidance line up with conditions on the ground?
Agreement can add context to a forecast scenario, while divergence can point to a less settled evolution. Neither tells a forecaster on its own which outcome will occur. The useful question is where models differ, how they differ and whether those differences matter for the decision in front of the user.
Translate weather spread into power outcomes
A single deterministic forecast describes one possible atmospheric evolution. An ensemble runs multiple forecasts to represent a range of plausible outcomes. The width of that range can help users understand how much the forecast system’s members differ, though the implications depend on the application and forecast horizon.
Cirrus v1.5 extends this approach to renewable generation. Its first ensemble-based power forecast takes ECMWF IFS ensemble weather guidance and processes it through Spire’s Power Generation Forecast. The result shows individual generation forecasts, the ensemble mean and a shaded spread around that mean, with output expressed in megawatts.
Wind and solar ensemble forecasts are available across all seven U.S. ISO/RTO markets and multiple European countries. For a wind forecast in Germany, users can see the range of generation supported by the ensemble rather than relying on a single expected-output curve.
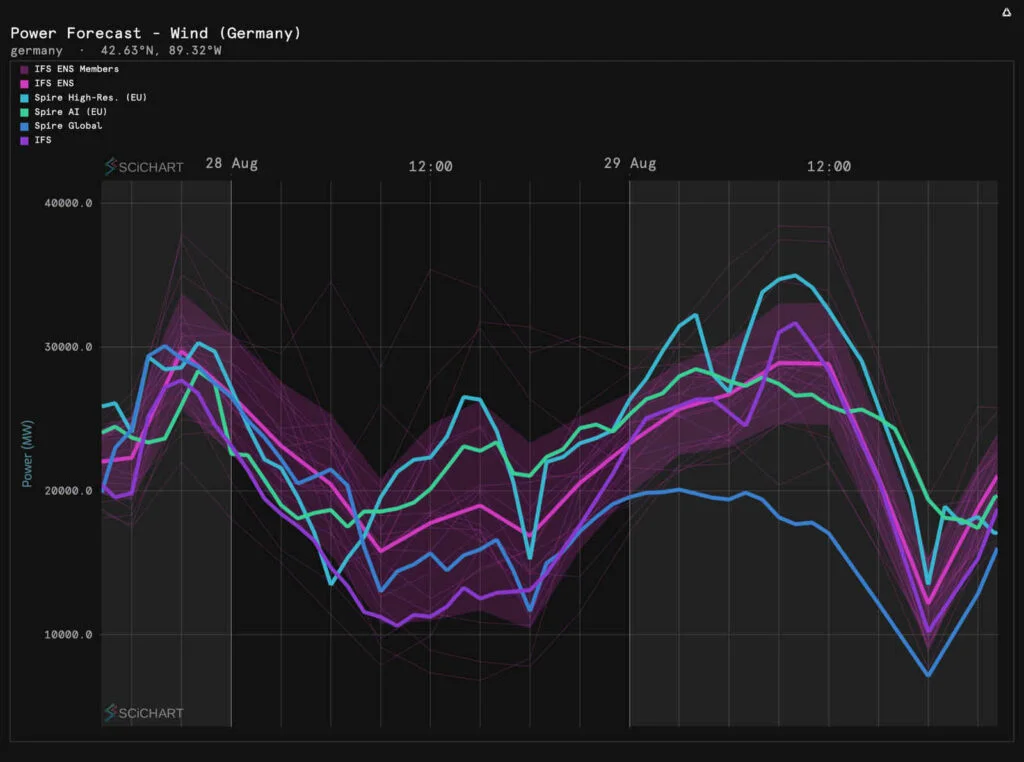
Wind power forecasts for Germany show the range of potential generation outcomes in megawatts across ensemble members and other model guidance.
For traders, renewable-energy forecasters and grid operators, the point is to understand not just what generation is forecast, but how broad the range of possible outcomes is and how that range changes. A shortwave solar-radiation map layer adds another view of the weather conditions behind solar generation forecasts.
Read disagreement with care
Model agreement doesn’t guarantee accuracy. Forecast systems may share biases or respond similarly to the same starting conditions, then converge on an outcome that doesn’t happen. Disagreement also isn’t simply a sign of poor guidance: it can expose sensitivity in the forecast and show alternatives that a single model would conceal.
A sound assessment combines multiple signals: differences across models, consistency between successive runs, ensemble spread, current observations and the forecast horizon. Cirrus puts these views closer together, allowing users to assess them within the same workflow.
Connect near-term forecasts to broader patterns
Some weather-sensitive decisions require a view beyond the coming days. Cirrus v1.5 adds a phase-space panel for tracking the Madden-Julian Oscillation, a large-scale pattern of tropical convection that can influence weather around the world. Users can step through its forecast evolution and display individual ensemble members to see both the projected progression and the range of possibilities.
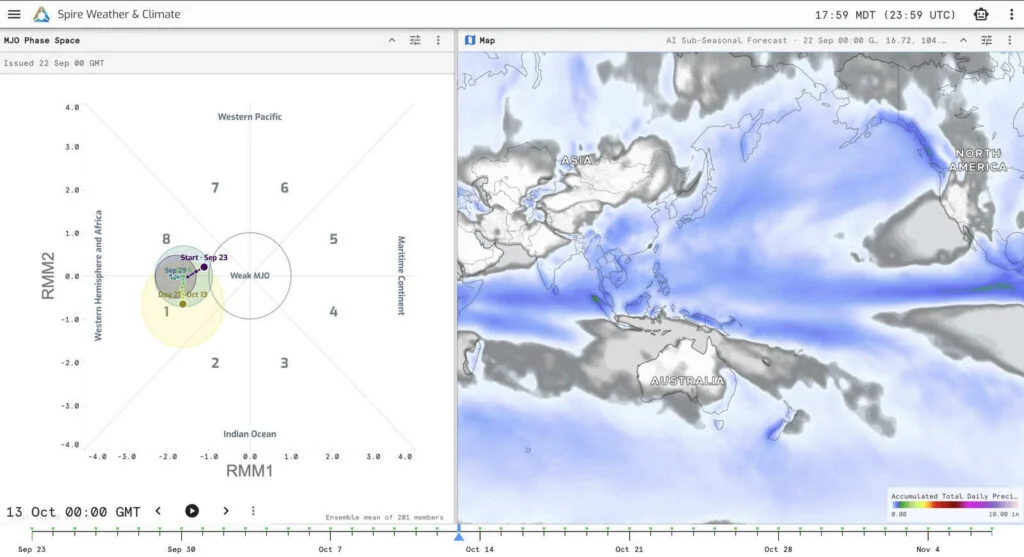
Track the forecast evolution of the MJO alongside broader weather patterns to add context to longer-range risk.
The MJO panel complements Cirrus’ weather-regime visualization. A meteorologist can watch whether ensemble members increasingly favor a particular MJO progression; an analyst can consider whether broader atmospheric signals align with patterns relevant to a region or market. The value lies in tracking how those signals evolve, not treating a long-range pattern as a precise local forecast.
Move analysis into operational communication
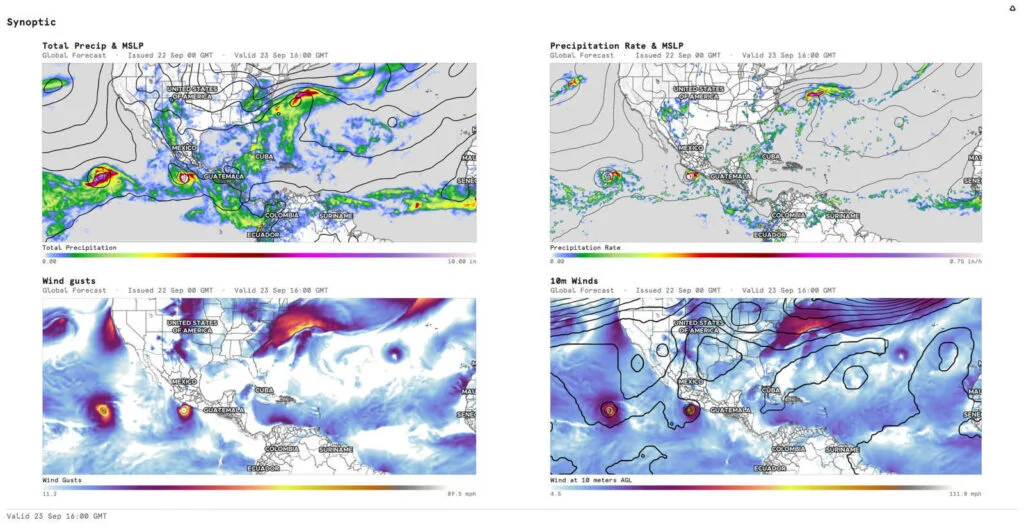
Export maps, charts and dashboards to share forecast insights in briefings, presentations and operational updates.
Cirrus v1.5 also adds ways to carry analysis into briefings and decisions. Users can export maps, charts and dashboard panels as PNGs or animations for presentations, morning notes and operational updates. Forecasts can be opened in a new window or sent to a selected panel, and chart panels can keep their locations as users change the map selection.
The release also improves dashboard loading and updates the charting tour. These workflow changes matter because forecast analysis has to be shared and revisited as new guidance arrives. Spire says its proprietary satellite observations provide an independent atmospheric data source alongside the model guidance in Cirrus.
More models don’t remove uncertainty; they make it possible to inspect it from more angles. Cirrus v1.5 brings model differences, observations, ensemble generation ranges and longer-range patterns into one place. For weather-informed teams, the useful takeaway is to assess the full spread of guidance—and how it changes—as part of the decision process.



Discussion
Sign in to join the discussion.